Microsoft Building footprint

Published

July 25, 2024

Why are we doing it?

Premises and Premise Counts

Currently we have FCC total count of locations (BSL) at the census block level.

MS Building Foot print

Overview

Microsoft (MS) used satellite data (from multiple campains/vintage) to get the footprint of buildings.

They are classifying pixels that are supposed to be part of a buildings (segmentation using a neural network) and then convert pixels to a shape.

It exists worldwide and for US states.

  • We have processed the 51 states

  • Additional works will be required for Puero Rico and the US territories (parts of workflow from the US states can be reused).

The precision of their model vary depending on the region: the Carribean is at 92,2% and the US at 98.5%. The rate of false positive is 1% for the US and 1.8% for the Carribean. (Oceania was not provided)

The license is ODbL.

Buildings to BSL?

Buildings are shapes, BSL are points. We converted the buildings to single point (arbitrary: the first vertex of the shape) to lower the amout of data. Hence, now we have “buildings” summarized to points (lat/long).

Our pipeline can be find here (private repo)

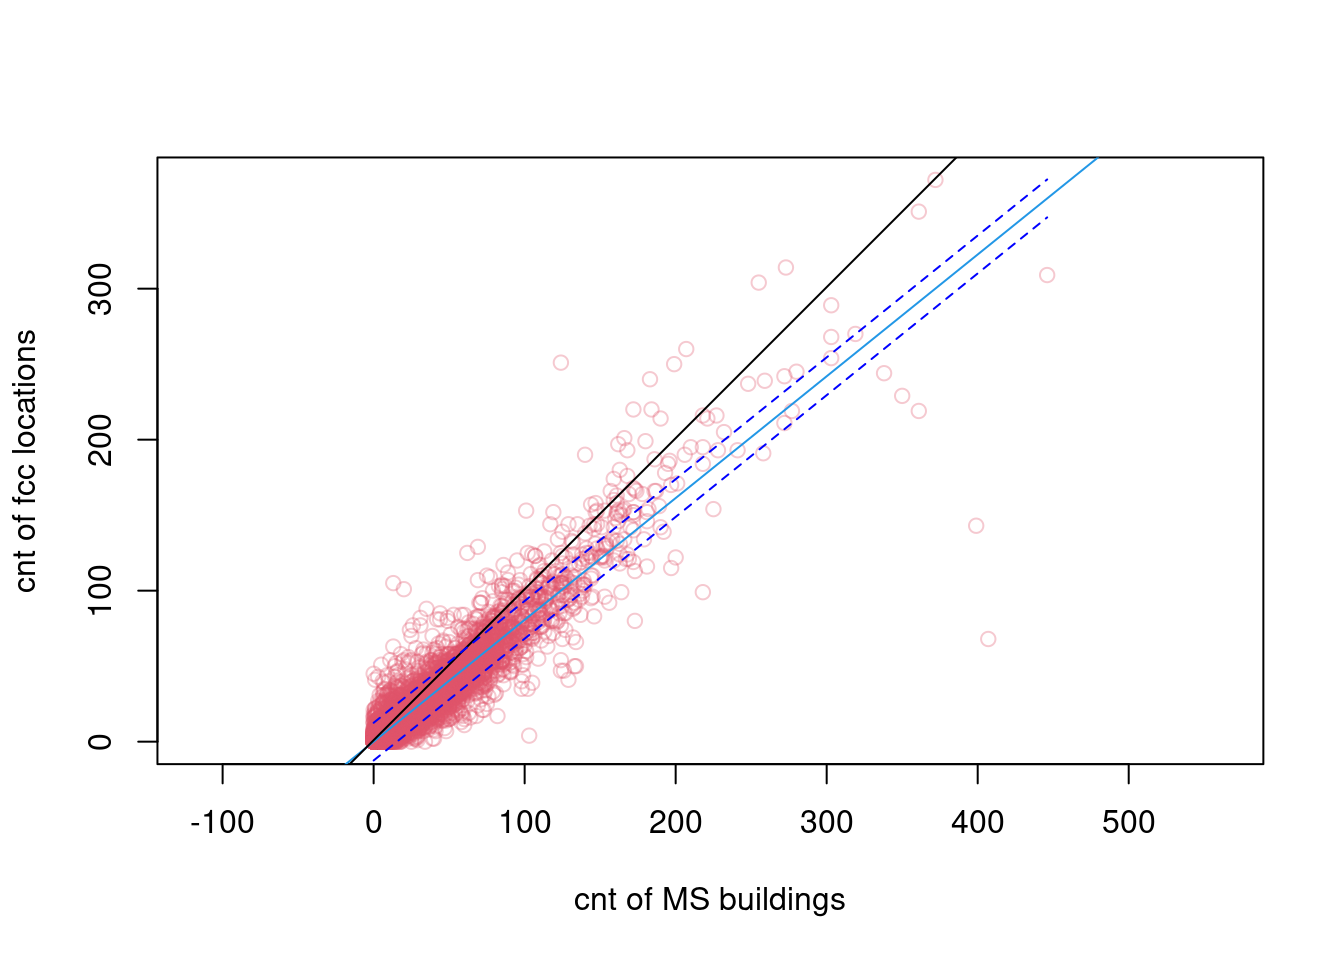
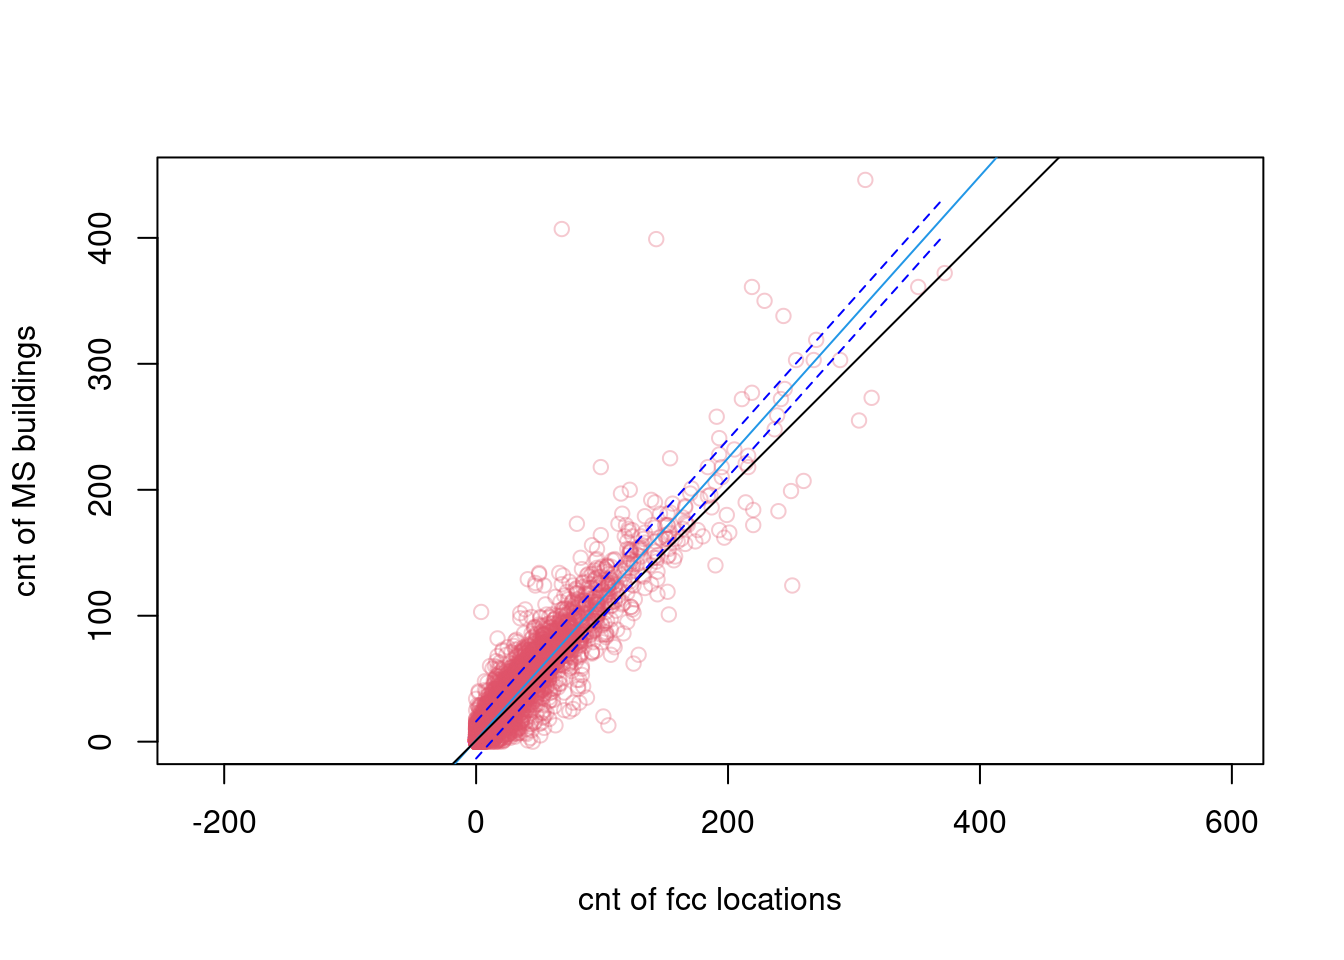
We do not have access to lat/long of BSL (this is only part of the fabric data). Our assumptions is if a count at block match they are describing the same reality (we can’t do the “on the ground verification”).

The number of buildings reported for 51 states is: 130 099 920

While is the number of BSL is: 114 074 438

Other potential sources:

Should this information be provided and how?

What could be the use cases?

Integrating those informations will have cost: information “overload”, documentation about it is needed

We can:

  • Provide the count per census block of MS building footprint and let the user decide on the quality of the data around their specific geography

  • Add the dot to the map

  • if we add dot and/or count per block, how trustworthy this is information will be: add a “confidence” about it (will always be statitical)

How this data helps BEAD applicant?

MS building footprint in VT

We can count those points per block and compare to the number of location than FCC is describing.

After that we build a small model that will provide either an estimate of BSL given MS footprint and how confidant the model is.

Code
vt <- read.csv("data/vt_ms.csv")
vt$tot_loc <-as.numeric(vt$tot_loc) 
vt$tot_loc <- ifelse(is.na(vt$tot_loc), 0, vt$tot_loc)

lm_loc <- lm(tot_loc ~  cnt_ms , data = vt)
pot_val2 <- seq(min(vt$cnt_ms), max(vt$cnt_ms), by = 0.025)
conf_interval <- predict(lm_loc, newdata = data.frame( cnt_ms = pot_val2) ,
                         interval = "prediction", level = 0.95)

plot(vt$cnt_ms, vt$tot_loc,  col = "#DF536B50", asp = 1, 
xlab = "cnt of MS buildings", ylab = "cnt of fcc locations") 
abline(lm_loc, col = 4)
abline(1:500, 1:500, col = "black")
lines(pot_val2, conf_interval[, "lwr"], col = "blue", lty = 2)
lines(pot_val2, conf_interval[, "upr"], col =" blue", lty = 2)

Code
lm_ms <- lm(cnt_ms ~ tot_loc, data = vt)
pot_val <- seq(min(vt$tot_loc), max(vt$tot_loc), by = 0.025)
conf_interval <- predict(lm_ms, newdata = data.frame( tot_loc = pot_val) ,
                         interval = "prediction", level = 0.95)

plot(vt$tot_loc, vt$cnt_ms,  col = "#DF536B50", asp = 1, 
ylab = "cnt of MS buildings", xlab = "cnt of fcc locations") 
abline(lm_ms, col = 4)
abline(1:500, 1:500, col = "black")
lines(pot_val, conf_interval[, "lwr"], col = "blue", lty = 2)
lines(pot_val, conf_interval[, "upr"], col =" blue", lty = 2)

  • Strong relation

  • the model is “overconfidant”, and the reality is more “spread” (what could possibly be the cause of it?)

  • VT MS has also more locations (285333, versus 352618)