Color scales for CORI data visualization
Usage
scale_fill_cori(palette = "ctg2gn", discrete = TRUE, reverse = FALSE, ...)

scale_color_cori(palette = "ctg2gn", discrete = TRUE, reverse = FALSE, ...)
Arguments
- palette
Character name of palette in
cori_palettes()- discrete
Boolean indicating whether color aesthetic is discrete or not. Defaults to
TRUE- reverse
Boolean indicating whether the palette should be reversed. Defaults to
FALSE- ...
Additional arguments passed to
ggplot2::discrete_scale()orggplot2::scale_fill_gradientn(), used respectively whendiscreteisTRUEorFALSE
Examples
library(ggplot2)
library(dplyr)
#>
#> Attaching package: ‘dplyr’
#> The following objects are masked from ‘package:stats’:
#>
#> filter, lag
#> The following objects are masked from ‘package:base’:
#>
#> intersect, setdiff, setequal, union
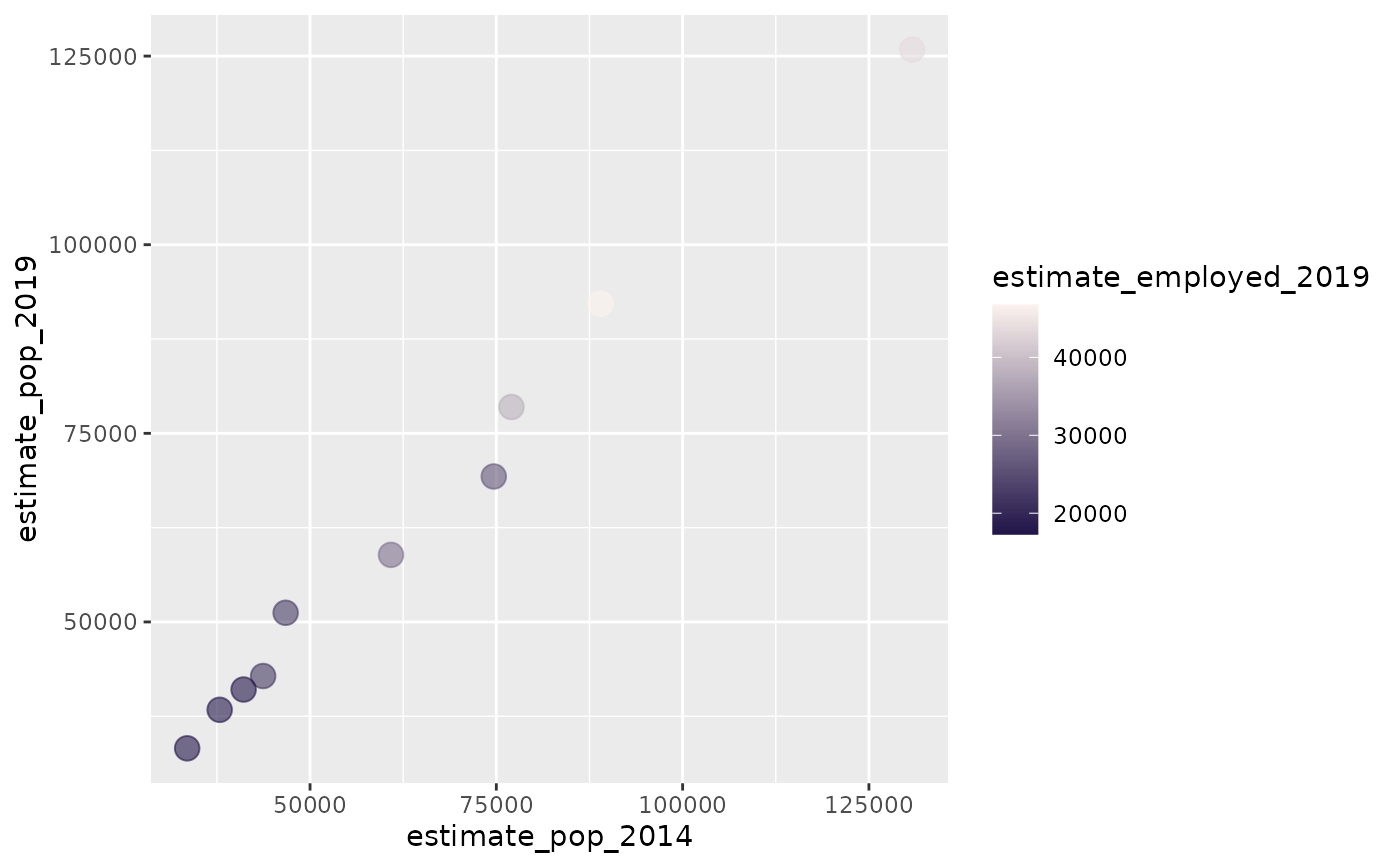
data(cori_employment)
cori_employment %>%
ggplot(
aes(estimate_pop_2014, estimate_pop_2019,
color = estimate_employed_2019
)
) +
geom_point(size = 4, alpha = .6) +
scale_color_cori(discrete = FALSE, palette = "ctg2pu")
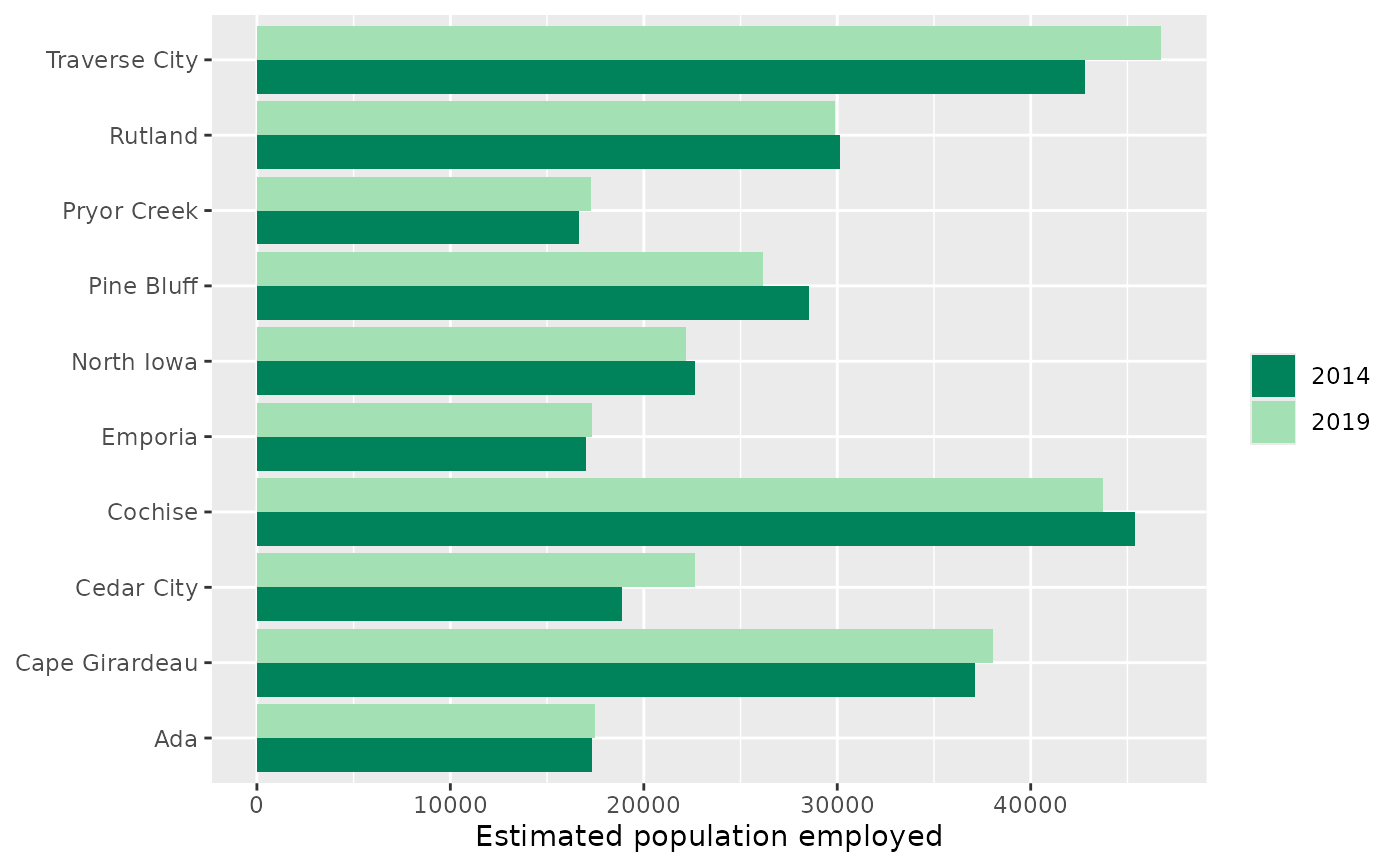
 library(tidyr)
library(stringr)
cori_employment %>%
pivot_longer(contains("employed")) %>%
mutate(name = str_remove(name, "estimate_employed_")) %>%
ggplot(aes(value, rin_community, fill = name)) +
geom_col(position = "dodge") +
scale_fill_cori() +
labs(x = "Estimated population employed", y = NULL, fill = NULL)
library(tidyr)
library(stringr)
cori_employment %>%
pivot_longer(contains("employed")) %>%
mutate(name = str_remove(name, "estimate_employed_")) %>%
ggplot(aes(value, rin_community, fill = name)) +
geom_col(position = "dodge") +
scale_fill_cori() +
labs(x = "Estimated population employed", y = NULL, fill = NULL)