Add a vertical or horizontal line with an annotation
Source:R/threshold_annotate.R
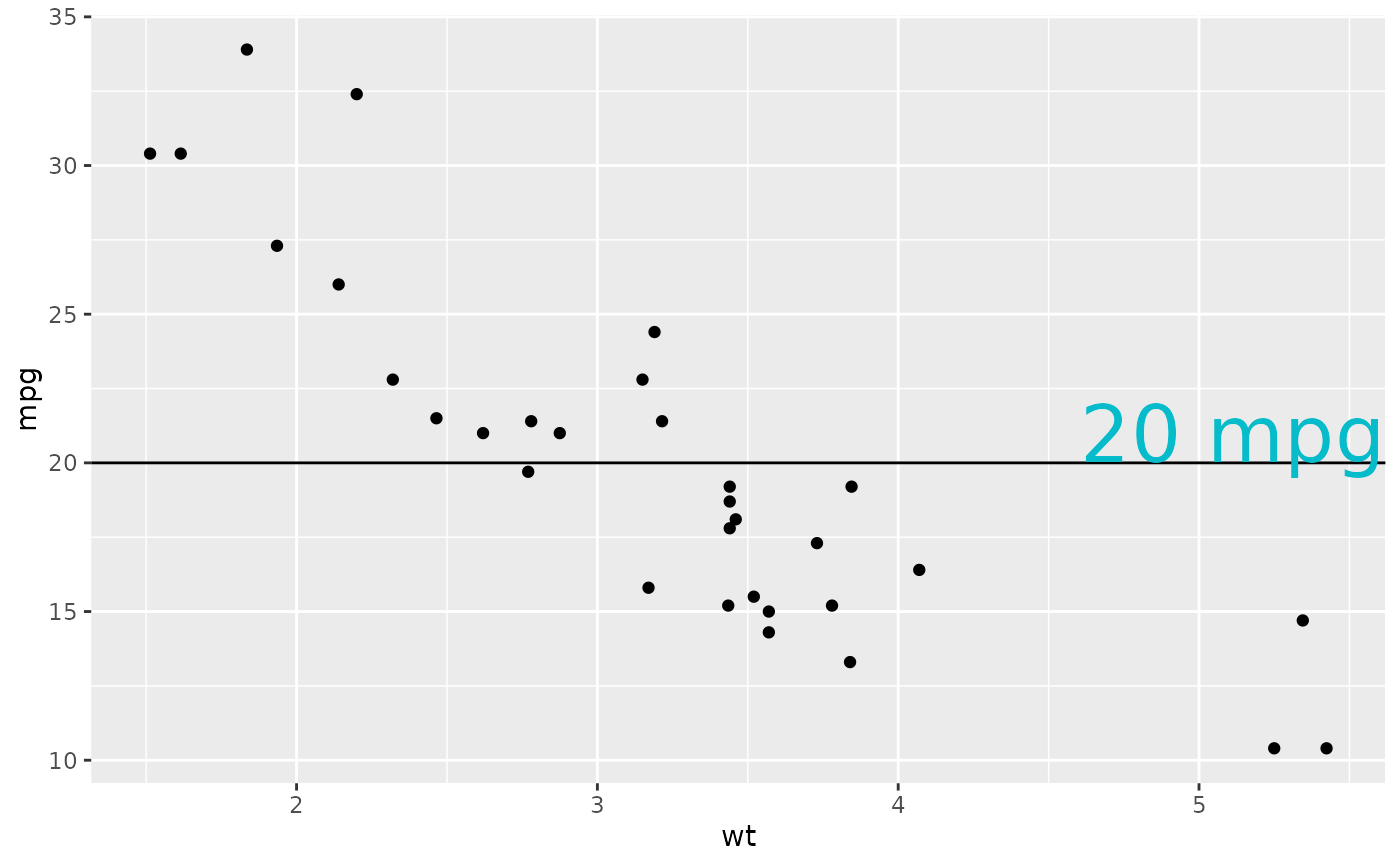
geom_threshold_annotate.RdThis is a utility function that allows the user to add a line threshold with text annotation using an intercept parameter. The shift parameter allows the user to relatively adjust the text with respect to the defined threshold value.
Usage
geom_threshold_annotate(intercept, axis = c("x", "y"), label = "", shift = 0)Arguments
- intercept
x or y intercept (indicated by
axis) through which the vertical or horizontal threshold is made.- axis
Axis along which a threshold is to be added, defaults to "x" indicating a vertical threshold
- label
Label to add to the graph, defaults to an empty string
- shift
How much to shift the label in
shiftunits above the threshold line along "y", or inshiftunits to the right of the threshold line along "x", defaults to 0
Examples
library(ggplot2)

ggplot(mtcars, aes(wt, mpg)) +
  geom_point() +
  geom_threshold_annotate(20, axis = "y", shift = 1, label = "20 mpg")