The FCC’s public release of the National Broadband Map should, in theory, allow broadband providers to maximize their access to the unprecedented availability of public and private investment funding, but utilizing this data continues to pose challenges for rural service providers.
One of our goals at the Center on Rural Innovation (CORI) is to support rural stakeholders with practical insights and applications that will empower them to bridge the digital divide and expand equitable access to the internet across underserved communities.
In this post, we aim to:
- Frame the pressing challenges faced by rural broadband providers.
- Explore the available public data about broadband access and coverage.
- Share the data and tools we’ve developed to help rural communities and broadband providers.
The challenge and the opportunity
At this time, reliable high-speed broadband access and widespread digital literacy are more critical than ever, yet vast areas of rural America remain underserved. This digital gap limits opportunities for education, healthcare, economic growth, and civic engagement in these regions. With billions of dollars in federal and state funding now available, the ability to analyze and interpret broadband data effectively is paramount. Providers need actionable insights to identify unserved and underserved areas, optimize funding applications, and plan infrastructure investments that meet local needs.
Why this matters now
The convergence of new funding opportunities and improved datasets represents a once-in-a-generation opportunity to close the digital divide. By leveraging accurate data and strategic planning, rural broadband providers can maximize their impact and secure funding to expand their services.
Investment in broadband, especially by small, locally-operated providers, can accelerate economic growth and prosperity in rural areas. Higher broadband utilization is associated with increased business growth rates, self-employment, per capita income, and GDP growth. Conversely, areas with low broadband utilization face economic stagnation and population decline.1
Private capital investment, alongside government funding, can help small broadband providers deploy infrastructure. However, uneven investment can lead to rural-urban and rich-poor divides in internet quality, because internet service providers tend to “invest in the best technology in areas where there are competitive environments, and they will invest in the latest technology in wealthier areas”.2 To counter this tendency we need compelling data-driven narratives and objectives that enable communities to hold their local provider(s) accountable, even as they make critical planning decisions that will reverberate for decades.3
Additionally, in regards to the Broadband Equity Access and Deployment Program, the largest offering of federal assistance for broadband infrastructure deployment to-date,4 the NTIA guidelines prioritize fiber deployment due to its reliability and future-proof capabilities, followed by other communications technologies (i.e. fixed wireless and satellite).5 While the NTIA acknowledges the necessity of alternative technologies in high-cost areas, it has emphasized that fiber’s high data transmission capacity can handle current and future broadband demands, ensuring that networks can grow alongside digital demands. This means that knowing precisely where fiber is available (or planned) is an essential prerequisite for the prudent allocation of investment priorities that will result in a long-term, reliable and resilient broadband ecosystem.6
The available data
The following explanation of the data sourced from the FCC is extracted from CORI’s FCC report, a work-in-progress exploratory data analysis produced by Olivier Leroy. Please visit the report for a deeper analysis of various aspects of this data.
We rely on two key datasets from the Federal Communications Commission (FCC):
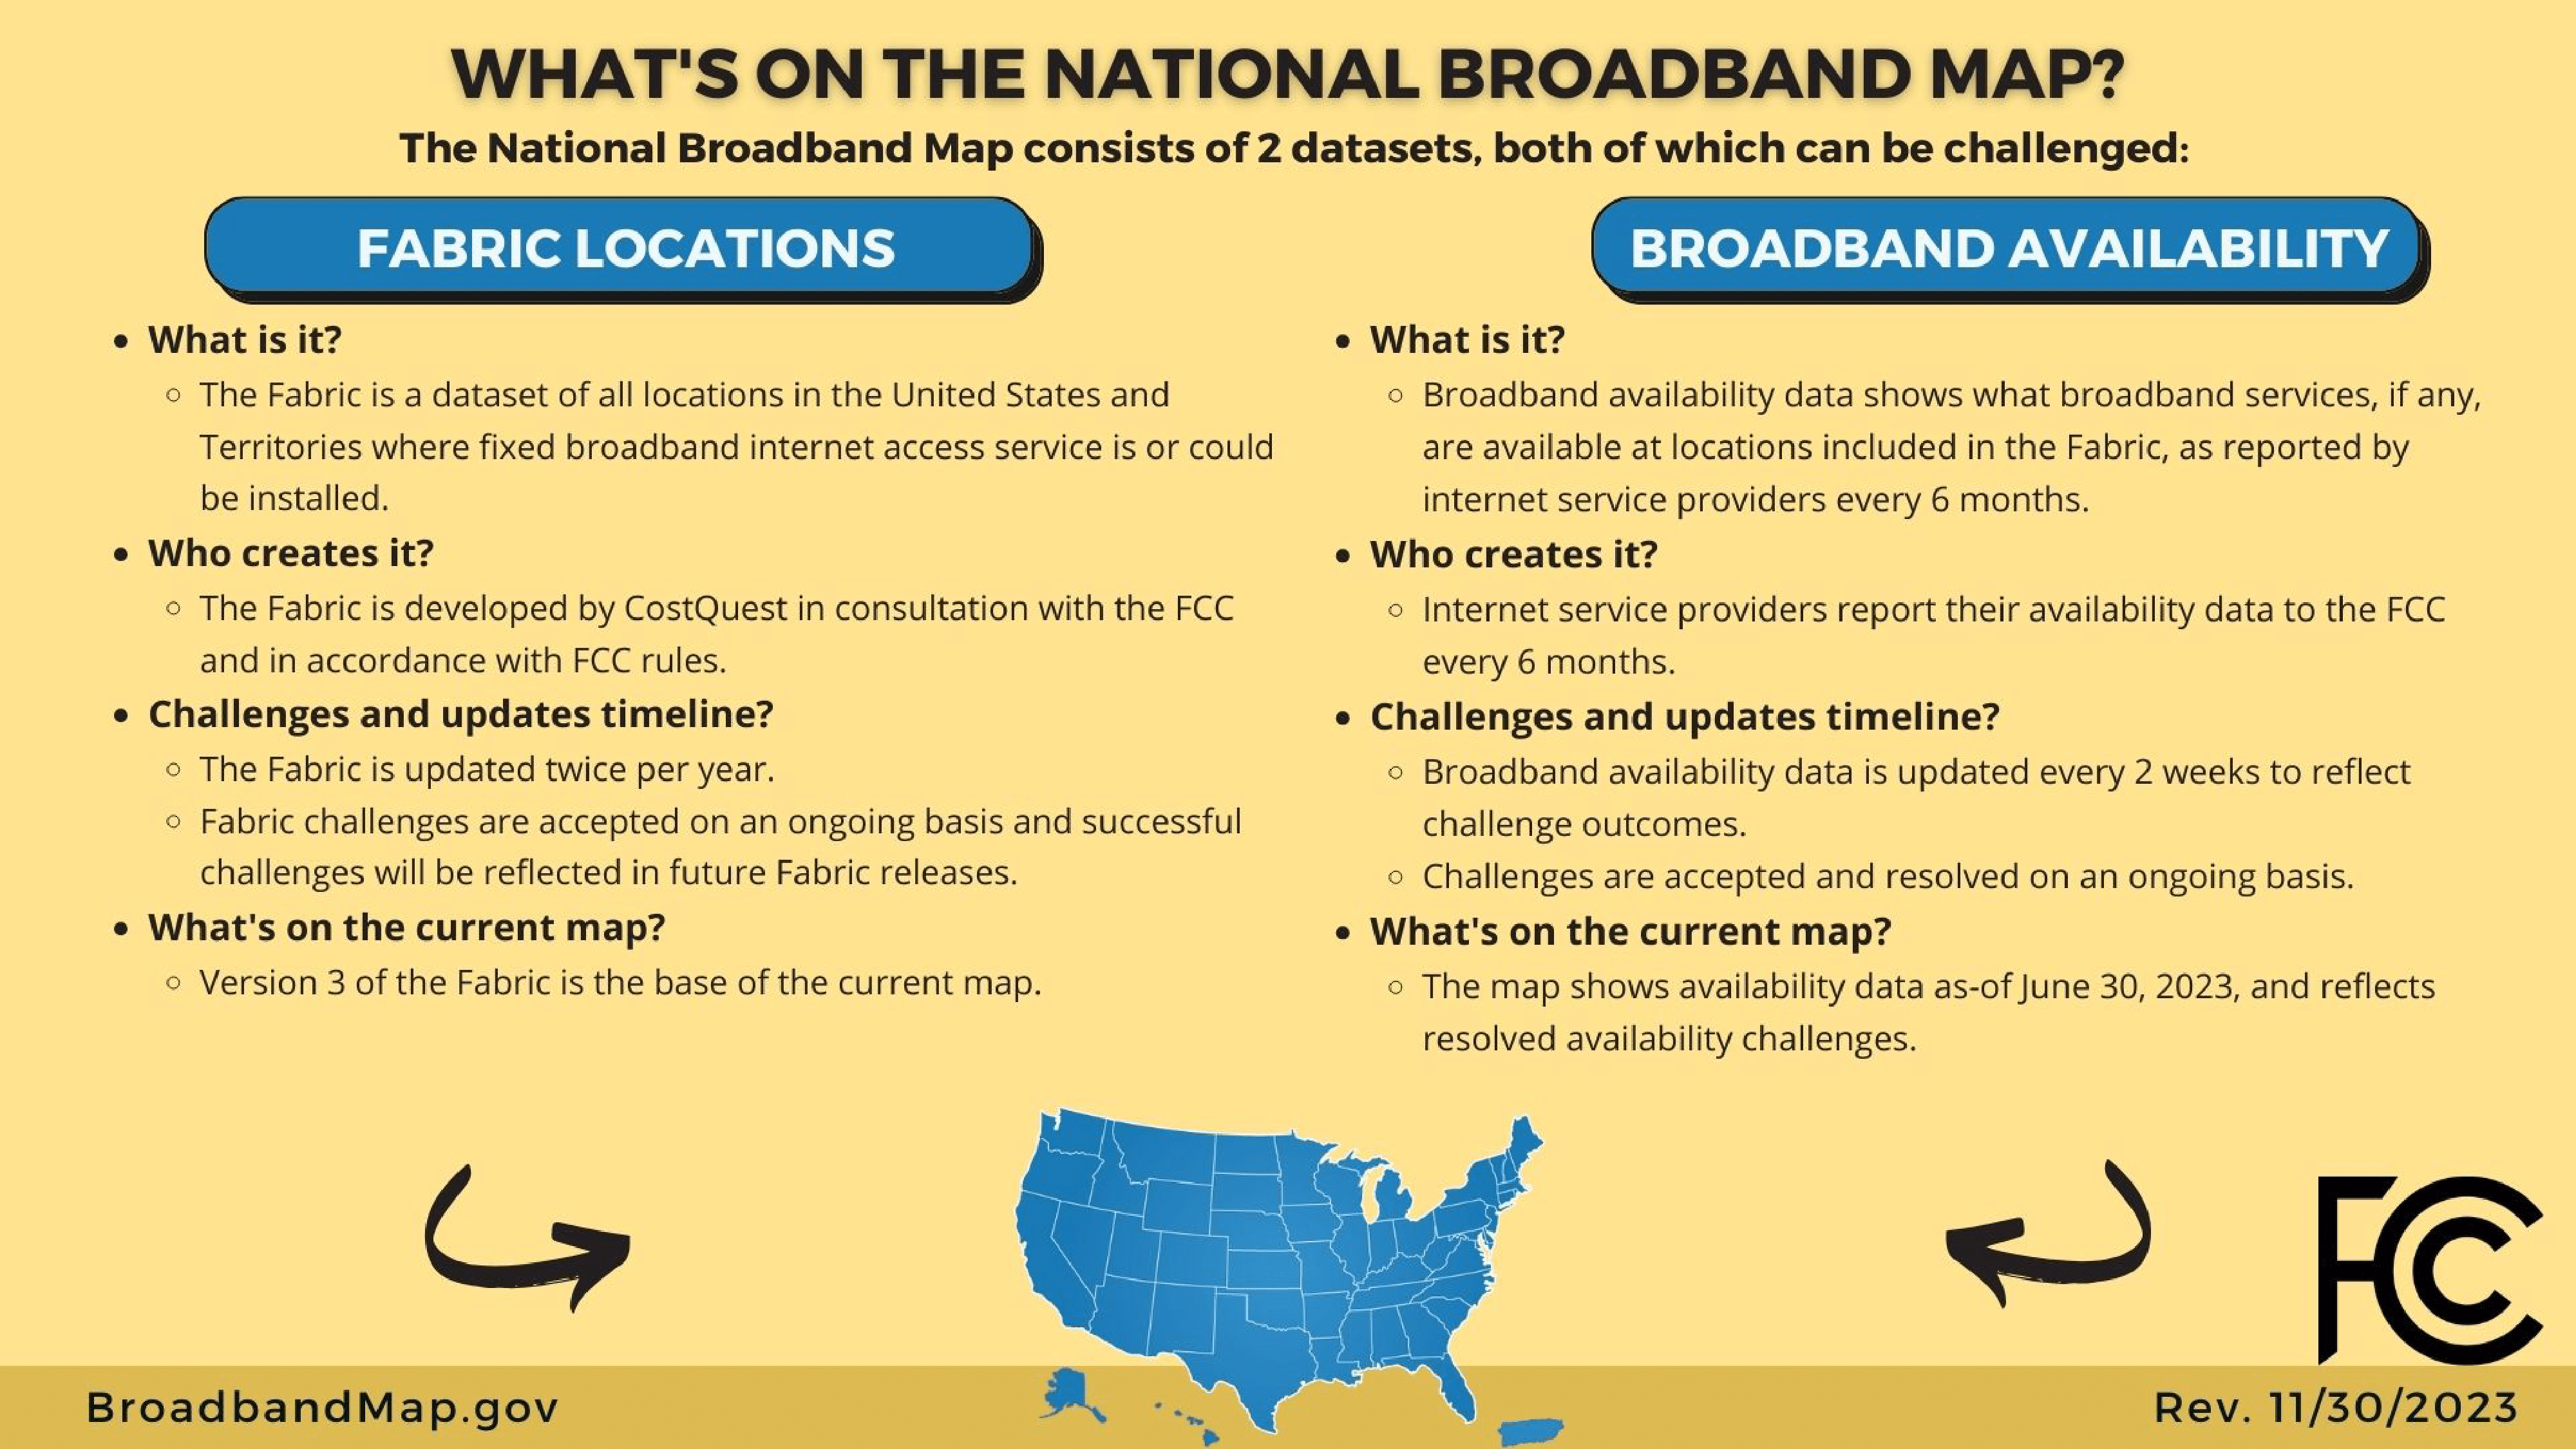
- National Broadband Map (NBM):
- Provides granular information on broadband service availability at specific locations, including details about service providers, technology types, and advertised speeds.
- Broadband Funding Map (BFM):
- Offers insights into federally funded broadband infrastructure projects, detailing program boundaries and project-level information.
Both datasets are publicly available under permissive licensing, making them invaluable tools for analyzing broadband coverage and funding opportunities. Licensing information can be found here and here, respectively.7
What are these two datasets?
On March 23, 2020, the Broadband Deployment Accuracy and Technological Availability Act or Broadband DATA Act was enacted8. This led to the FCC’s creation of the National Broadband Map (NBM) in November 20229 and the Broadband Funding Map in May 202310 (documented in July 202311) as the primary methods of publicly releasing these datasets.
In the legislation and sometimes on FCC documents the process of collecting this data is called Broadband Data Collection (BDC).
National Broadband Map (NBM)
The NBM offers detailed broadband availability information:
- Identifies providers and technologies at each location.
- Classifies locations as residential, business, or both.
- Localizes data to census blocks or H3 hexagons.
This dataset is an abstraction of the “Fabric” locations data developed by CostQuest. The Fabric provides precise geolocation data for Broadband Serviceable Locations (BSLs), which are updated biannually (June and December) with interim updates every two weeks. The exact coordinates for each locations are only inclued in the Fabric dataset, so using the National Broadband Map data we can only link a record for a location to a Census Block (2020 vintage) or H3 hexagon.
Every location is characterized by:
- Who is providing those services (
frn,provider_id, andbrand_name) - A description of each of the services (
technology,max_advertised_download_speed,max_advertised_upload_speed,low_latency) - Whether the location is characterised as residential, business or both
- Ways to geographically locate it (
state_abbr,block_geoid,h3_res8_id)
A location (see What is a BSL?) can be covered by multiple Internet Services Provides (ISP) with potentially different services and technologies. Hence, it can be represented in the data by many “rows”.
Broadband Funding Map (BFM)
The BFM provides information about “broadband infrastructure deployment projects funded by the Federal government throughout the United States”. The public data:
- Categorizes projects by program and geographic boundaries.
- Highlights funding from four federal agencies across 12 programs, including 1,853 projects as of May 2024.
- Provides a critical resource for identifying areas targeted for infrastructure investment.
The information is structured either at the scale of a specific project inside a program or for the whole program. Hence we have characteristics for each project, including their associated boundaries (territories covered) (see https://ruralinnovation.github.io/proj-fcc-report/fcc_funding.html).
What is a Broadband Serviceable Location (BSL)?
A Broadband Serviceable Location (BSL) is defined as a location in the U.S. where fixed broadband internet access service is available or can be installed. These include:
- Residential BSLs: Housing units or group quarters as defined by the U.S. Census Bureau.
- Business BSLs: Non-residential structures, such as government or nonprofit facilities, on properties without residential locations.
A broadband serviceable location is defined as “a business or residential location in the United States at which fixed broadband Internet access service is, or can be, installed.” A residential BSL includes all residential structures, including structures that are (or contain) housing units or group quarters (as those terms are defined by the United States Census Bureau). A business BSL includes “all non-residential (business, government, non-profit, etc.) structures that are on property without residential locations and that would expect to demand Internet access service.” (source FCC12)
Geographic coverage
- Broadband Availability Data: Covers all U.S. states, Puerto Rico, and U.S. territories.
- Funding Map Data: Varies by program, with coverage reflecting specific project boundaries.
What is “Unserved” vs. “Underserved”?
The FCC defines broadband access levels as follows:
- Served: Locations with at least one service offering speeds of 100/20 or higher.
- Underserved: Locations with speeds of at least 25/3 but below 100 Mbps download / 20 Mbps upload (100/20).
- Unserved: Locations with maximum advertised speeds below 25 Mbps download / 3 Mbps upload (25/3).
Served, Unserved and Underseved are overlapping categories at the location level. They can be extended at the “area level”.
These definitions, rooted in the FCC’s Broadband Speed Benchmark, can be adapted by states to suit local conditions13.
Tools for big broadband analytics
Beginning in 2023 and throughout 2024 we developed the following tools to support rural broadband providers and local policymakers:
cori.data.fcc: R package that facilitates the discovery, analysis, retrieval and use of FCC public data releases.- Because the FCC publishes major releases of this data twice a year and minor updates at a nearly biweekly cadence, we developed
cori.data.fccto ease the process of provisioning our various applications with the latest broadband coverage data.
- Because the FCC publishes major releases of this data twice a year and minor updates at a nearly biweekly cadence, we developed
CORI Data API: This backend was designed and implemented to provide an assortment of broadband service metrics and demographic data at multiple geographic levels (county, tract, block, etc.)Built with AWS Lambda and RDS (PostgreSQL)
Continuously deploys from code commits using AWS CDK
This allowed us to build multiple frontend applications that incorporate a mix of backend data sources, including CORI Data API and Mapbox (styles and tile sets):
Rural Broadband Service Map: Visualizes broadband availability and funding data to identify gaps and opportunities.
Rural Broadband County Summary: Summarizes broadband availability and demographic data per county (by name or FIPS).
Broadband Climate Risk Mitigation Tool: Assesses climate risks posed to broadband infrastructure in order to enhance resiliency.
These tools are vital for connecting rural areas, acting as a bridge to digital opportunities and effective investment of resources. Instead of just providing raw data, CORI’s resources turn complex information into clear insights, enabling deliberate, informed choices about where to direct funds and build infrastructure.
Here’s how this suite of tools helps to improve broadband investment, expansion, and digital skills:
- Simplified Data Management: The
cori.data.fccpackage streamlines the process of accessing and utilizing the FCC’s frequently updated data, ensuring that users always have the most current information at their fingertips - Comprehensive Data Analysis: The CORI Data API delivers key broadband metrics and demographic information across different geographic areas, enabling a detailed understanding of local needs and opportunities
- Targeted Visualizations: The Rural Broadband Service Map offers a visual representation of broadband availability and funding, highlighting areas with service gaps and potential for growth.
- Concise Summaries: The Rural Broadband County Summary provides a snapshot of broadband and demographic data for each county, facilitating quick comparisons and informed decision-making.
- Risk Assessment: The Broadband Climate Risk Mitigation Tool evaluates potential climate-related threats to broadband infrastructure, promoting the development of more resilient networks.
The broadband tools offered by CORI highlight underserved areas, attracting focused infrastructure investment. By visualizing current broadband availability and funding, the maps identify gaps, guiding strategic expansion and making sure resources go where they’re most needed to promote fair access and close the digital gap. In this way we make accessible the data and insights needed to create persuasive funding requests. With broadband metrics and demographic details, applicants to BEAD and other public funding programs can build a strong case for investment, highlighting local needs and project potential.
Internet service providers that avail themselves of these resources can create resilient networks that deliver reliable, high-speed internet by analyzing coverage and assessing climate risks. Strategic broadband investments, particularly by smaller, local providers, spark economic growth in rural areas. As previously mentioned, increased broadband use correlates with higher business growth, self-employment, income, and GDP. CORI tools empower these providers to make data-informed decisions about infrastructure deployment in collaboration with local communities. CORI’s resources support data-backed infrastructure planning, aligning investments with community needs.
While focused on infrastructure, these tools also help to increase digital skills by expanding broadband in underserved areas. Reliable internet is essential for digital literacy, enabling multiple stakeholders, policymakers and residents alike, to develop skills and plan their participation in the digital world. Digital literacy leads to individual growth that boosts local economies which then attract new businesses. Ultimately, these tools help the rural communities and broadband providers that strategically and holistically invest in infrastructure, to encourage and enable digital inclusion.
Copyright © 2025 Center On Rural Innovation
Footnotes
Footnotes
Weinstein, A., Erouart, M., & Dewbury, A. (2024) Beyond Connectivity: The role of broadband in rural economic growth and resilience. Center on Rural Innovation. https://ruralinnovation.us/resources/reports/report-the-role-of-broadband-in-rural-economic-growth-and-resilience/↩︎
Pigeons are still (sometimes) faster than your internet https://www.washingtonpost.com/technology/2023/11/10/pigeons-are-faster-than-your-internet/↩︎
Capital Beginning to Flow in Advance of BEAD Allocations - Inside Towers https://insidetowers.com/capital-beginning-to-flow-in-advance-of-bead-allocations/↩︎
Notices of Funding Opportunity for the Broadband Equity Access and Deployment Program https://www.ntia.gov/funding-programs/internet-all/broadband-equity-access-and-deployment-bead-program/program-documentation/notice-funding-opportunity-broadband-equity-access-and-deployment-program↩︎
Final Guidance for BEAD Funding of Alternative Broadband Technology https://www.ntia.gov/blog/2025/final-guidance-bead-funding-alternative-broadband-technology↩︎
A Deep Dive On the BEAD Alternative Technology Guidelines https://www.telecompetitor.com/a-deep-dive-on-the-bead-alternative-technology-guidelines/↩︎
License and Attribution language from the FCC:
Broadband availability data from the BDC, and data from the U.S. Census Bureau that are presented on this site, are offered free and not subject to copyright restriction. Data and content created by government employees within the scope of their employment are not subject to domestic copyright protection under 17 U.S.C. § 105. See, e.g., U.S. Government Works.
While not required, when using in your own work content, data, documentation, code, and related materials from fcc.gov or broadbandmap.fcc.gov, we ask that you provide proper attribution of the data. Examples include:
Source data: FCC Broadband Funding Map
Map layer based on FCC BFM
CostQuest Associates, Inc. and its third-party licensors, as applicable, own all right, title, and interest, including all intellectual property rights, in and to the data for locations reflected in the Fabric (including the Location ID, latitude and longitude, address, unit count, and building type code for each location in the Fabric). CostQuest is granted certain rights to Fabric correction submissions for the purpose of correcting or otherwise modifying BDC Fabric data. Broadband service providers, governmental entities, and other third parties are able to license Fabric data, including any changes to Fabric data that have been made as a result of challenges, at no cost for purposes of their participation in the FCC’s Broadband Data Collection.↩︎Broadband Data and Mapping Background and Issues for the 117th Congress https://crsreports.congress.gov/product/pdf/r/r45962↩︎
https://www.fcc.gov/news-events/notes/2022/11/18/new-broadband-maps-are-finally-here↩︎
Page 4 https://www.pewtrusts.org/-/media/assets/2023/06/un–and-underserved-definitions-ta-memo-pdf.pdf↩︎